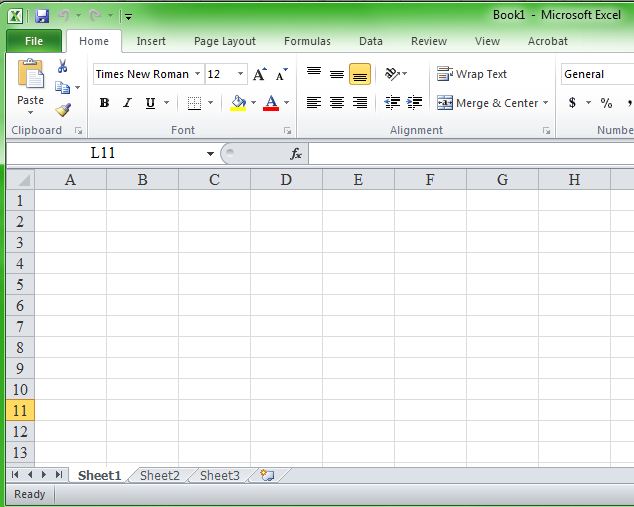
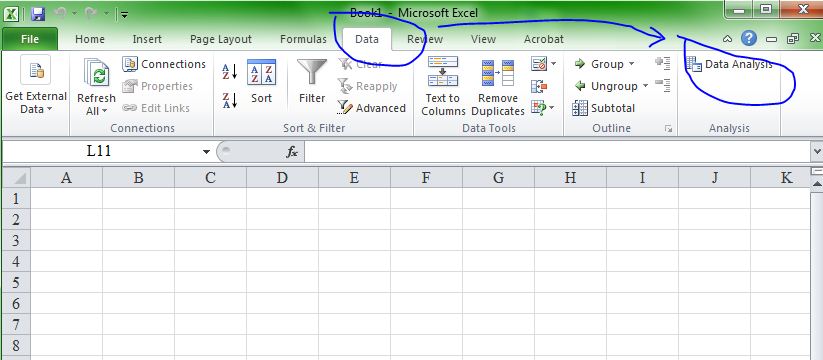
After you open Excel, you will see a table of rows and columns. The columns are lettered A, B, C, etc. and the rows are numbered 1, 2, 3, etc. A "cell" is denoted by the letter of the column and the number of the row, for example, the first cell is A1. The Excel 2010 looks like the following
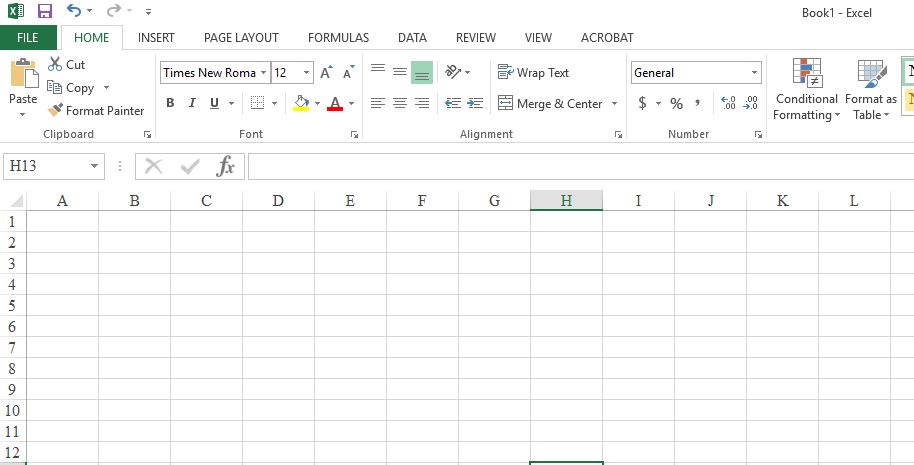
The Excel 2013 looks like the following
If your Excel is version 2010, first click the Data tab of Excel 2010 and see if the Data Analysis tool is at the top right corner.
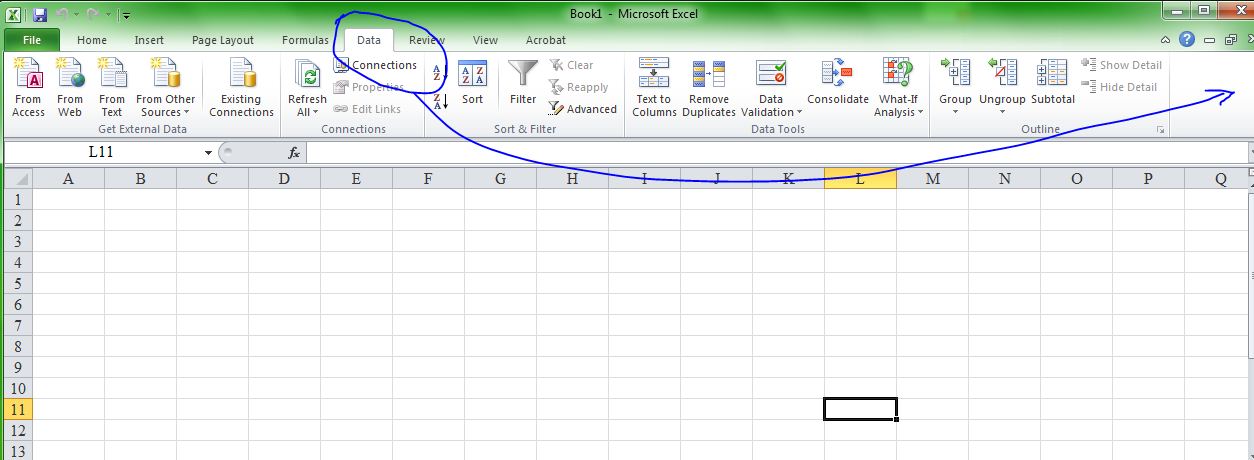
If it is there, skip the following and go directly to 3. Entering Data. Otherwise, follow the procedure below to add in the data analysis tool.
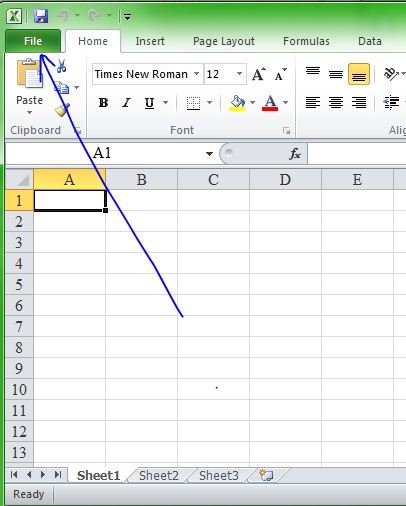
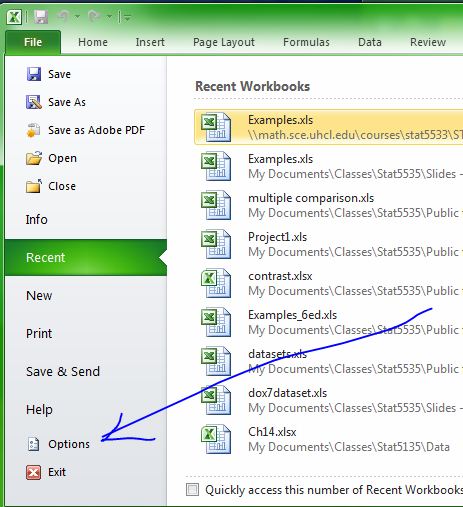
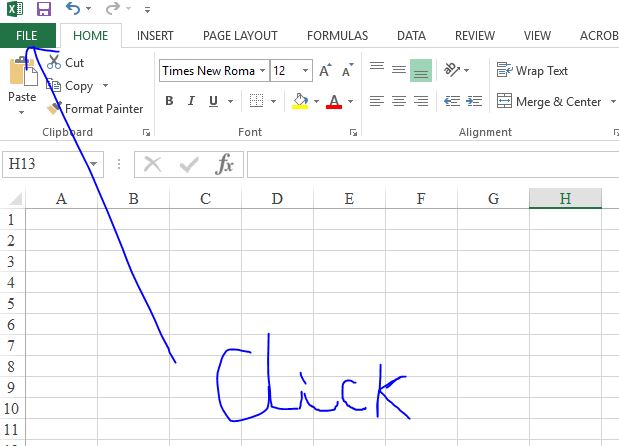
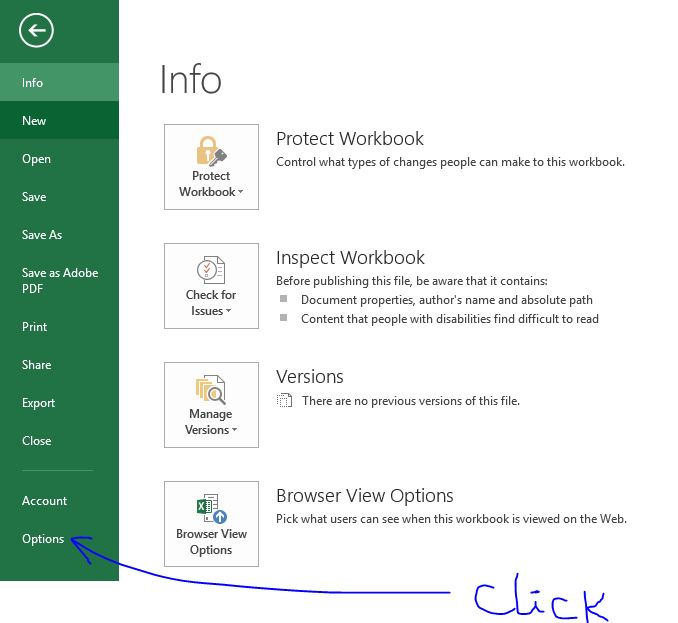
Click the green File tab at the top left corner and then click the Options on the left panel.
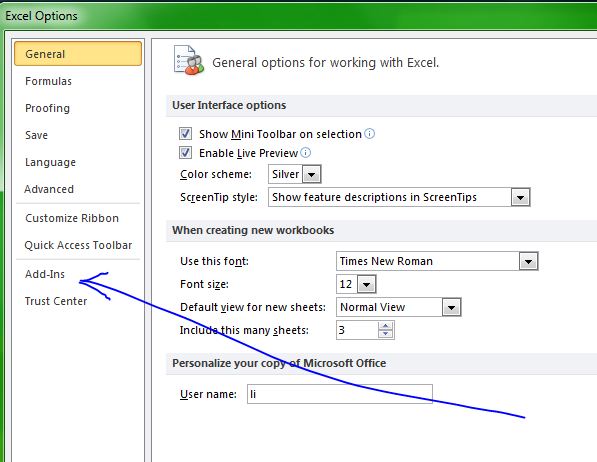
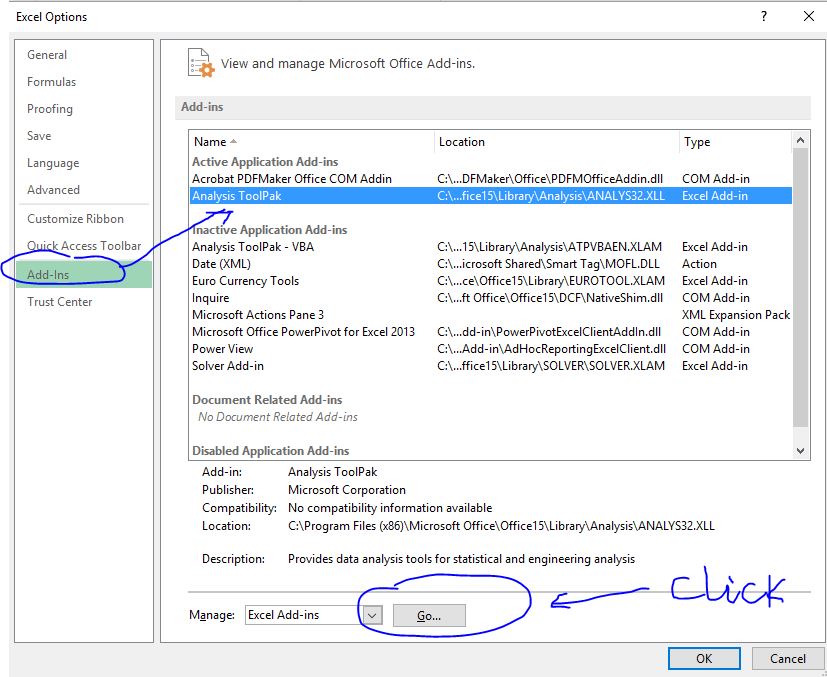
After you click the Options, a new window named Excel Options will pop up. Then click the Add-Ins on the left panel.
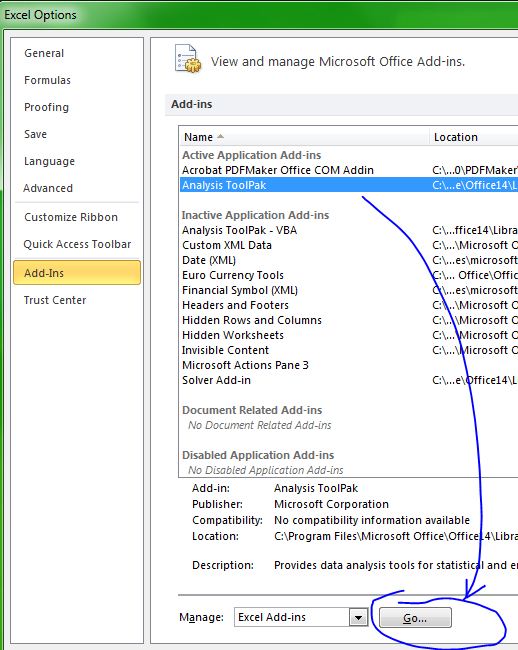
In the window of Add-Ins, select Analysis ToolPak and then click Go at the bottom.
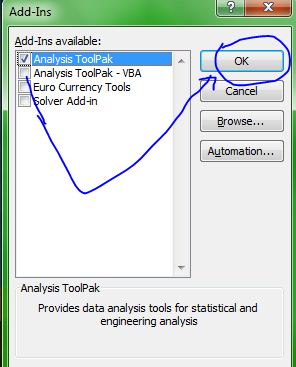
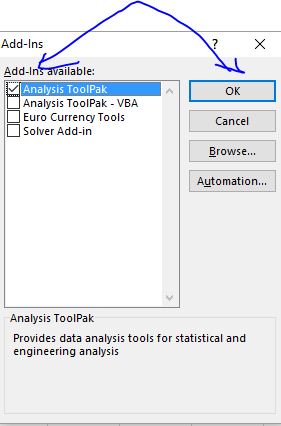
After you click the Go, a new window named Add-Ins will pop up. Then check the box by Analysis ToolPak and then click OK.
Now if you click the Data tab of Excel 2010, you will see the Data Analysis tool at the top right corner.
If your Excel is version 2013, first click the Data tab of Excel 2013 and see if the Data Analysis tool is at the top right corner.
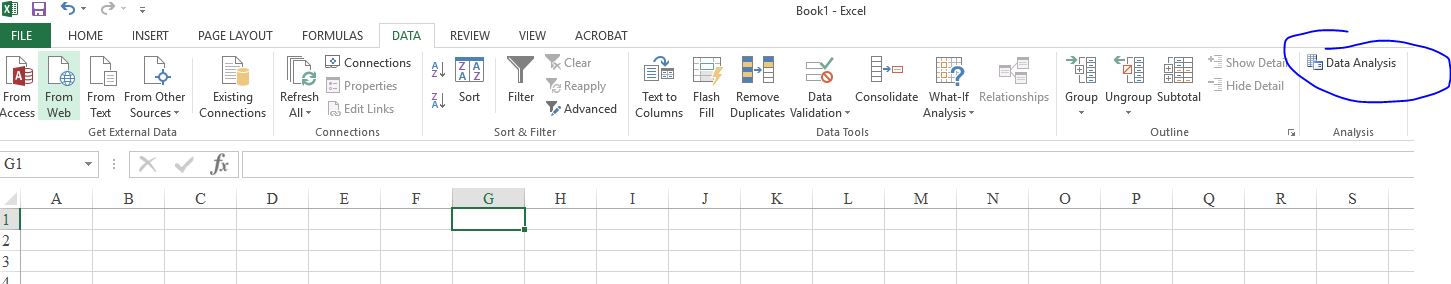
If it is there, skip the following and go directly to 3. Entering Data.
Otherwise, follow the procedure below to add in the data analysis tool. Click the green File tab at the top left corner and then click the Options at the bottom of the left panel.
After you click the Options, a new window named Excel Options will pop up. Then click the Add-Ins on the left panel. In the right window of Add-Ins, select Analysis ToolPak at the top and then click Go at the bottom.
After you click the Go, a new window named Add-Ins will pop up. Then check the box by Analysis ToolPak and then click OK.
Now if you click the Data tab of Excel 2013, you will see the Data Analysis tool at the top right corner.
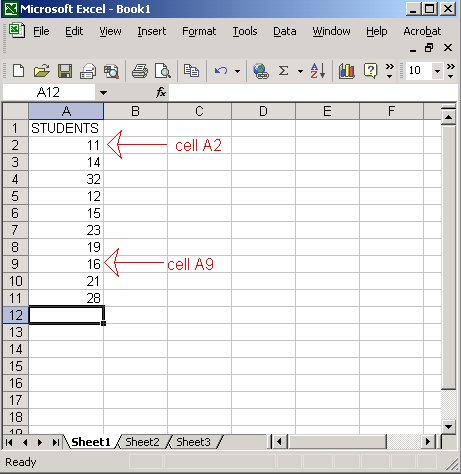
EXERCISE: For this exercise we will have a sample of student class size. Click in the spreadsheet window and in the cell A1 type the variable (label) "students". Then enter any ten numbers into the first ten cells below the label.
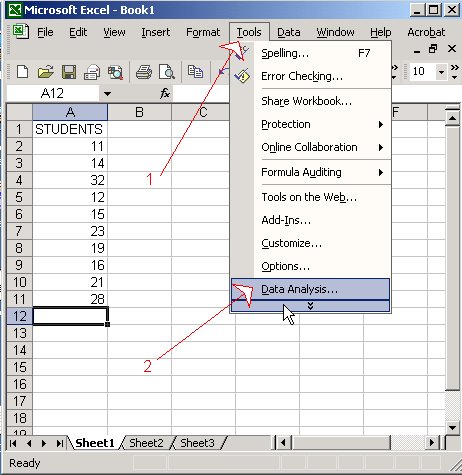
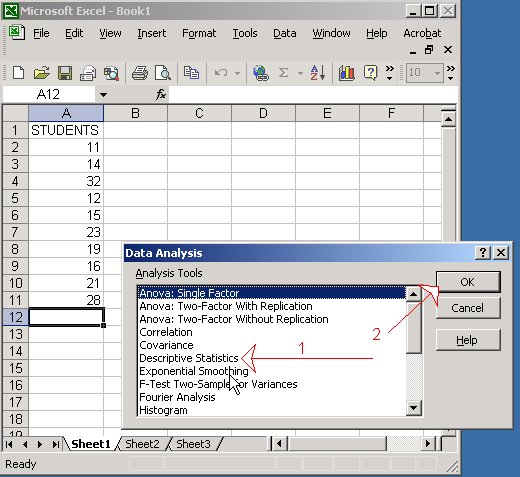
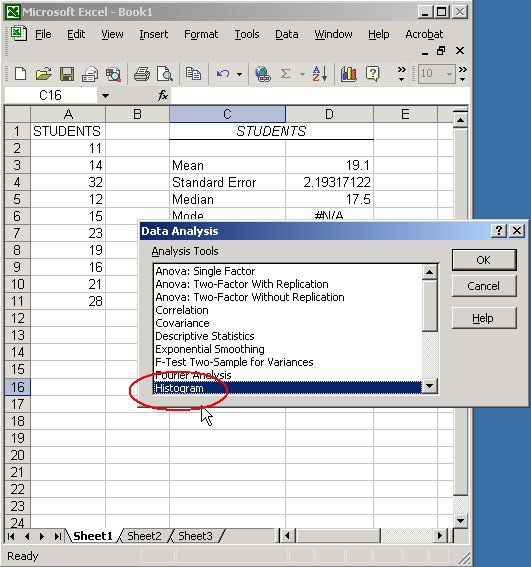
The pop-up window provides many choices for statistical analysis. For example we can obtain the summary statistics for the data of student class size.
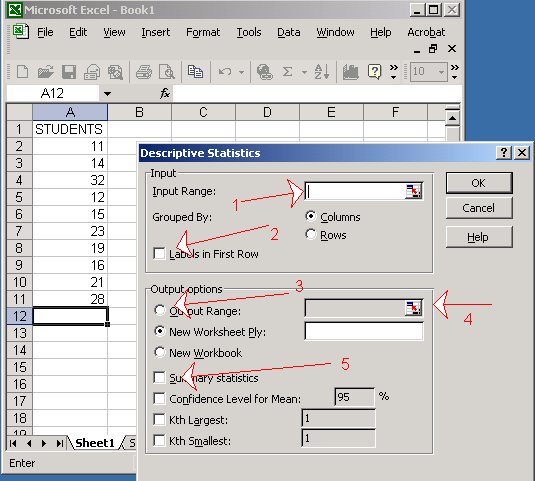
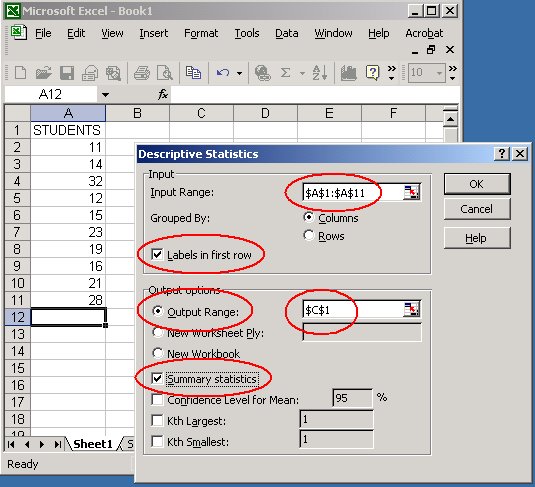
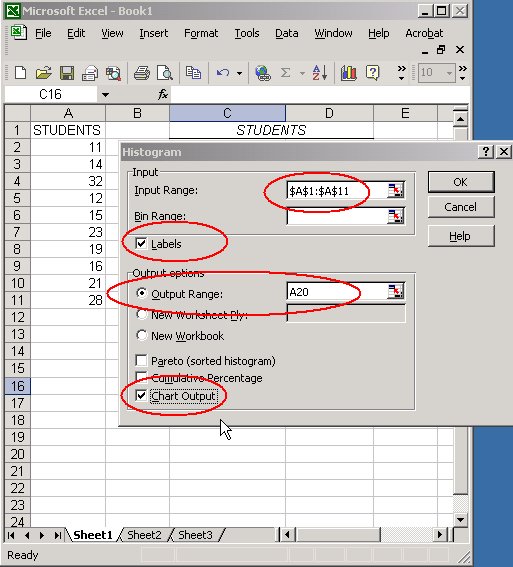
Input Range can be done by directly typing "first cell", "colon", "last cell" OR by clicking the "first cell" and then holding down SHIFT key and then clicking the "last cell" and releasing SHIFT key. For the example of student class size, type in A1:A11 OR click the first cell A1 and then hold down SHIFT key and then click the last cell A11 and releasing SHIFT key. Then you will see $A$1:$A$11 in the Input Range.
Since subject is grouped in column, Columns is selected. And first cell A1 is just a label, not data, Labels in first row is selected.
For Output option, we usually want to output results in the same worksheet of data. To do that, first select the Output Range and then click the cell after Output Range once. And then click or type in the cell in worksheet as start of output. Certainly, in order to obtain output, you have to select your statistics such as Summary statistics.
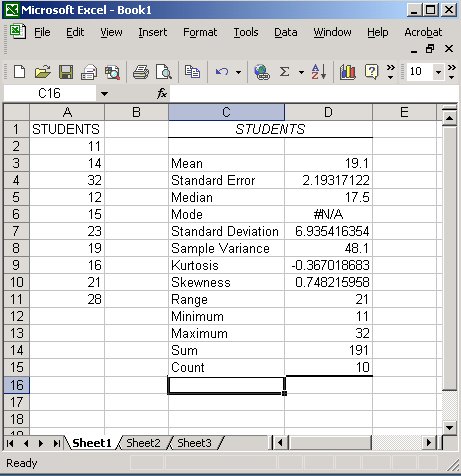
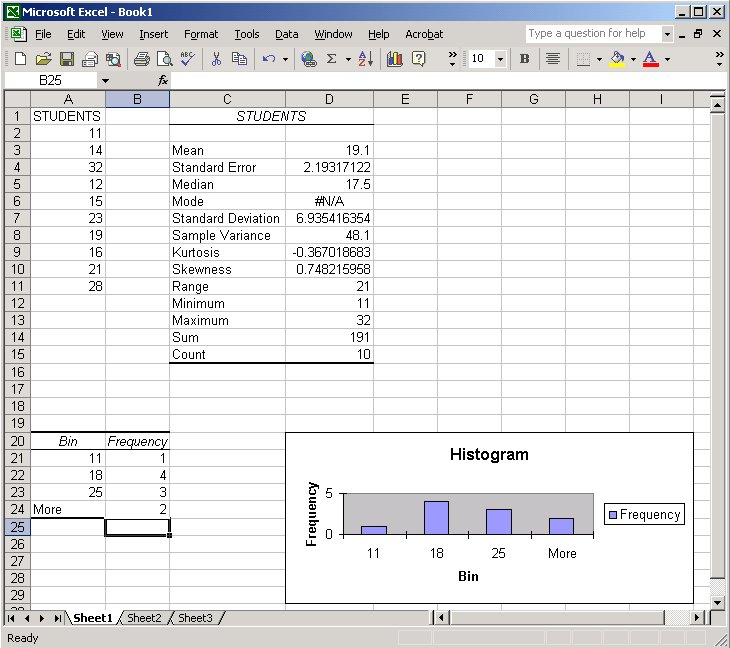
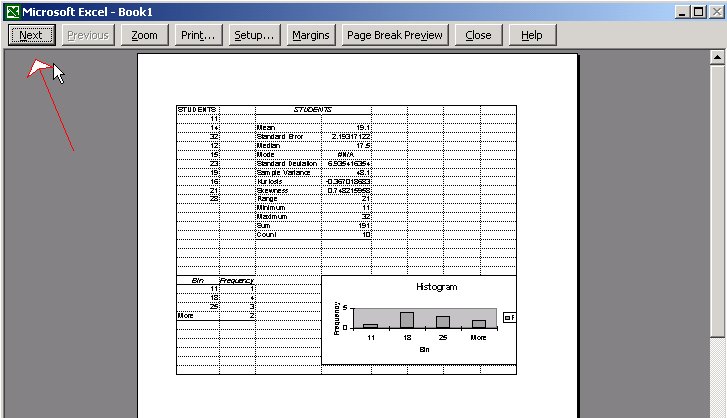
Finally select OK to get the results. The "Descriptive statistics" menu choice returns a number of answers.
Select the options desired. If you know the number of classes and class upper limits, put them down into Bin Range. Otherwise, Excel will generate histogram by default.
A histogram is a pictorial representation of frequency. If you forget to select Chart Output, you can only obtain the frequency table, no histogram.
To save your work to a floppy disk, use the menu file-save.